
Houston remains the largest US metro area most economically tied to oil and gas. Houston benefited from those ties from 2011 to 2014, during a period of high oil prices, adding 380,000 jobs. But since then, oil prices have dropped significantly. While nearly all sectors of the area's economy have felt that drop, some have felt it more than others. The apartment market is receiving a noticeable impact. This article originally appeared in the August 2016 issue of Texas Real Estate Business.


The Push for Amenities
During the 2011 to 2014 boom, strong absorption, tightening occupancies, rapidly increasing lease rates and an optimistic job growth outlook encouraged developers to add supply. Increasing construction costs and land costs, combined with the above factors, meant that developers seeking the best financial returns focused this new supply at the top end of the market. Many new complexes feature luxurious amenities and structured parking, with lease rates pushing much higher than historically considered reasonable for Houston.
New mid-rise properties commonly offered lease rates near $2 per square foot, whereas typical Class A rates just a few years earlier had been under $1.60 and under $1.40 in many locations. New high-end high rise developments in the urban core have been even more ambitious on rates, well exceeding $2 per square feet and even reaching toward $3.
However, this transformation of the Class A market through new development and increasingly luxurious orientation was not equally spread around the Houston region. Emphasizing the apartment market’s ties to nearby employment, the new Class A supply clustered in areas with ready access to concentrations of white-collar upstream oil and gas jobs, such as the Energy Corridor, Westchase, Downtown and The Woodlands.
Professional jobs in the oil and gas sector are known for requiring ample education and paying correspondingly ample salaries, allowing these employees to pay the soaring rents. Furthermore, new high-end apartment projects in the urban core have been benefiting from a new phenomenon of affluent, middle-aged “empty nester” suburban homeowners switching to renting as a lifestyle choice.
As new development lags the condition of the economy, owing to the time necessary for site acquisition, capital allocation and construction, new Class A supply is continuing to come on line in these same submarkets through 2016 despite the oil and gas sector’s reversal of fortune.
The inevitable result is that Class A occupancies in these submarkets are decreasing and incentives and specials are becoming commonplace at properties still in lease-up phase. It can be expected that lease rate appreciation in these submarkets will also stagnate in the near term.
Uneven Market
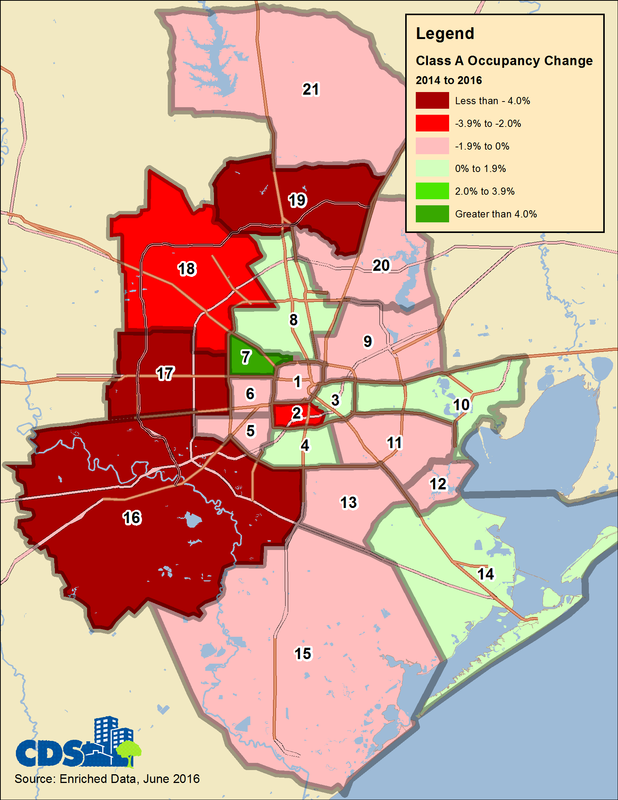
However, not all parts of the Houston region are equally sharing in the pain. Suburban areas whose residential markets are less driven by proximity to white collar upstream oil and gas employers, and which received relatively smaller increases in new apartment supply, are not suffering near as much decrease in Class A occupancy.
For example, the southern Brazoria County submarket, where Class A occupancy has exceeded 98 percent in recent years, dropped to 96 percent as of first quarter 2016. The ship channel/Baytown area also remains quite healthy for Class A, with occupancies at 94 percent.
In these markets, massive investments in downstream oil and gas refining and petrochemical facilities are bringing in a well-paid construction workforce, which will transition to a smaller permanent workforce along with frequent surges in temporary workforce that produces demand for apartments.
These submarkets provide a positive contrast to those like the Energy Corridor, where occupancies in Class A properties have dropped from 95 percent in 2014 down to nearly 88 percent by first quarter 2016.
It should be noted that parts of the urban core are also proving somewhat more resilient. The Inner Loop Northwest, which includes River Oaks, Upper Kirby, Montrose, Washington Avenue and the Heights, has experienced drops of occupancy from 2014 to 2016 of only about 2 percent, even though nearly 2,700 units were added during that period.
The increased general attractiveness of Houston’s urban core, spurred by the increasingly vast array of quality dining, entertainment and park space options, appears to be providing some insulation from the extent of the damage being inflected in some suburban submarkets.
One other consideration should be made when evaluation the impact of the recent economic changes in Houston on the apartment market. As Class A rents rose, properties became increasingly out of reach for those in less well-paid occupations, which have also grown substantially. Thus, many renters instead sought out Class B units.
Furthermore, moderate-wage service occupations in the retail, health care and education have grown as well, since demand for such jobs is correlated with population growth, and growth in these industry sectors is expected to continue through 2016.
Despite these pressures, little Class B supply has been added to the market. Class B properties are not suffering nearly the occupancy declines and renter incentives that Class A properties have.
For example, the Energy Corridor submarket still had Class B occupancy in excess of 91 percent in first quarter 2016, having dropped only about 4 percent from 2014 compared to a 7 percent drop for Class A. In the urban core, Class B occupancies also remain between 92 and 95 percent, down only slightly from earlier highs.
Conclusion
While Houston may present an easy-to-comprehend story of apartment overbuilding on the surface, a true understanding of current market risks and opportunities can only come from a more detailed assessment. A market analysis of individual submarkets is the only way to have the needed information to provide satisfactory assurance to back up investment or development decisions, even when times seem tough.
About the Author: Steve Spillette is President of CDS Community Development Strategies and has performed a variety of market studies and financial pro-forma analyses for both private and public clients. Mr. Spillette has several years of experience in retail market analysis and multiple degrees related to real estate and planning--including an MBA from Texas A&M University.
 RSS Feed