
Steve Spillette
CDS Community Development Strategies
CDS Community Development Strategies
Much has been said recently about the relationship between Houston and the price of oil. While most agree that the local economy is more robust than it once was, many are still wondering just how big an impact low oil prices will have. One way to answer this question is to look at how the region was impacted by high oil prices in the recent past. The synopsis: it added over 100,000 six-figure income households—something future growth is not expected to duplicate any time soon.

Oil and Gas Jobs
Compared to any other four-year period, the average price of oil from 2011 to 2014 was the highest in history. During this period, the Houston area experienced a phenomenal economic boom bringing many new jobs and households to the region. Industry sectors related to oil and gas played a disproportionate impact in this growth, according to data from the Quarterly Census of Employment and Wages (QCEW), provided by the Bureau of Labor Statistics. The following three selected industry sectors made up 5.3% of total employment in 2011, but accounted for nearly 10% of the increase in employment from 2011 to 2014.
Compared to any other four-year period, the average price of oil from 2011 to 2014 was the highest in history. During this period, the Houston area experienced a phenomenal economic boom bringing many new jobs and households to the region. Industry sectors related to oil and gas played a disproportionate impact in this growth, according to data from the Quarterly Census of Employment and Wages (QCEW), provided by the Bureau of Labor Statistics. The following three selected industry sectors made up 5.3% of total employment in 2011, but accounted for nearly 10% of the increase in employment from 2011 to 2014.
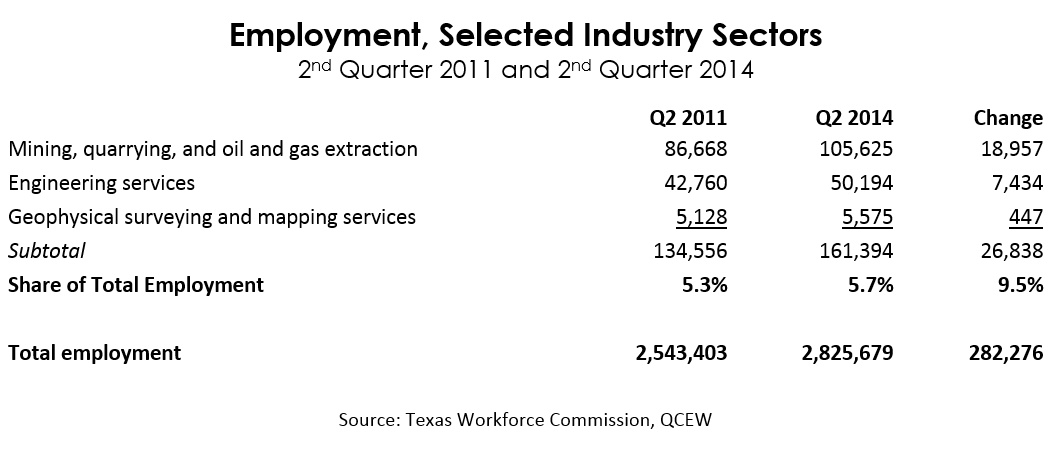
In Houston, many other industry sectors have significant shares of jobs related to upstream oil and gas as well (legal service, financial services, manufacturing, etc.), so the above numbers are likely understating the role of upstream oil and gas during that period.
Upscale Housing
An interesting feature of the boom, when it came to the production of housing to accommodate the influx of households to the region, was the focus of new home construction at the upper end of the market (both single family and multifamily). Houston has long been known as one of the most affordable big cities in America, especially in contrast to markets on the East and West coasts. So the surging construction of new housing offered at decidedly upscale prices, without a corresponding increase in more affordable housing for Houston’s traditional middle class, was a bit of a shock for many. Existing housing in many neighborhoods, especially those with well-reputed public schools, also appreciated in value rapidly, which affected even those who weren’t interested in moving by increasing property taxes and rents.
So what drove this trend in prices? Well, part of it was simply the overall supply-demand equation. The total amount of new households in the region increased more rapidly than the ability of homebuilders to keep up. Furthermore, after the Great Recession, the availability of mortgages at the lower end of the market was challenged by tighter lending requirements. This effectively discouraged the production of for-sale housing serving the lower end of the market. At the same time, construction costs for housing also rose due to scarcer supplies of materials and labor.
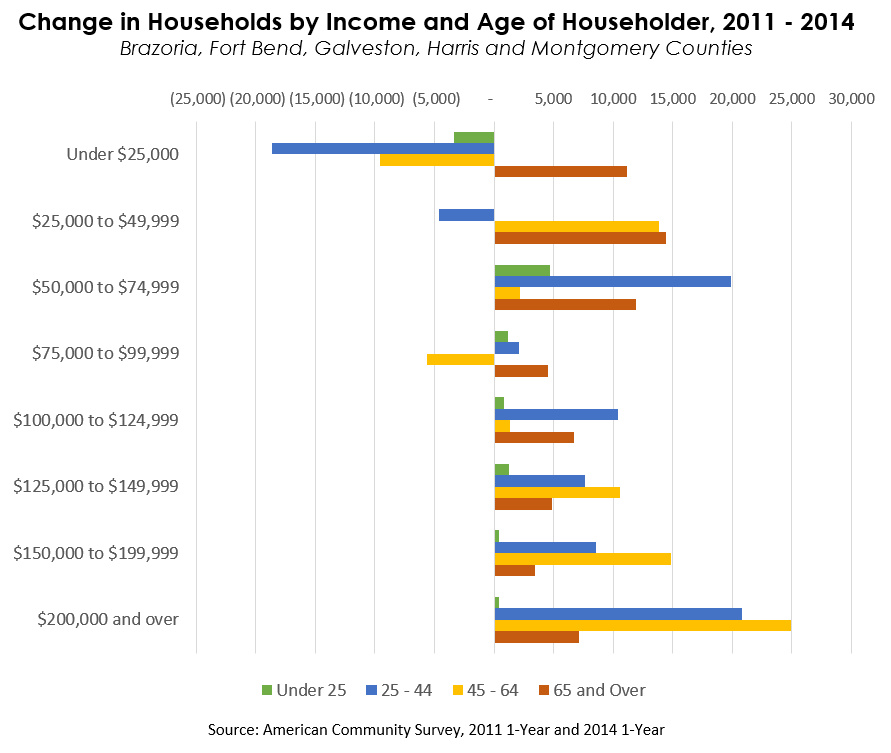
New High Income Households
The following chart shows that while there were households added in working-class income ranges under $50,000 a year, there was a dramatic jump in six-figure income households. This jump was particularly concentrated in households headed by persons in their prime working years between age 25 and 64. Even very young-headed households showed strong increase in the $50,000 to $75,000 income range. The area median household income was estimated at roughly $60,000 in 2014.
Upscale Housing
An interesting feature of the boom, when it came to the production of housing to accommodate the influx of households to the region, was the focus of new home construction at the upper end of the market (both single family and multifamily). Houston has long been known as one of the most affordable big cities in America, especially in contrast to markets on the East and West coasts. So the surging construction of new housing offered at decidedly upscale prices, without a corresponding increase in more affordable housing for Houston’s traditional middle class, was a bit of a shock for many. Existing housing in many neighborhoods, especially those with well-reputed public schools, also appreciated in value rapidly, which affected even those who weren’t interested in moving by increasing property taxes and rents.
So what drove this trend in prices? Well, part of it was simply the overall supply-demand equation. The total amount of new households in the region increased more rapidly than the ability of homebuilders to keep up. Furthermore, after the Great Recession, the availability of mortgages at the lower end of the market was challenged by tighter lending requirements. This effectively discouraged the production of for-sale housing serving the lower end of the market. At the same time, construction costs for housing also rose due to scarcer supplies of materials and labor.
New High Income Households
The following chart shows that while there were households added in working-class income ranges under $50,000 a year, there was a dramatic jump in six-figure income households. This jump was particularly concentrated in households headed by persons in their prime working years between age 25 and 64. Even very young-headed households showed strong increase in the $50,000 to $75,000 income range. The area median household income was estimated at roughly $60,000 in 2014.
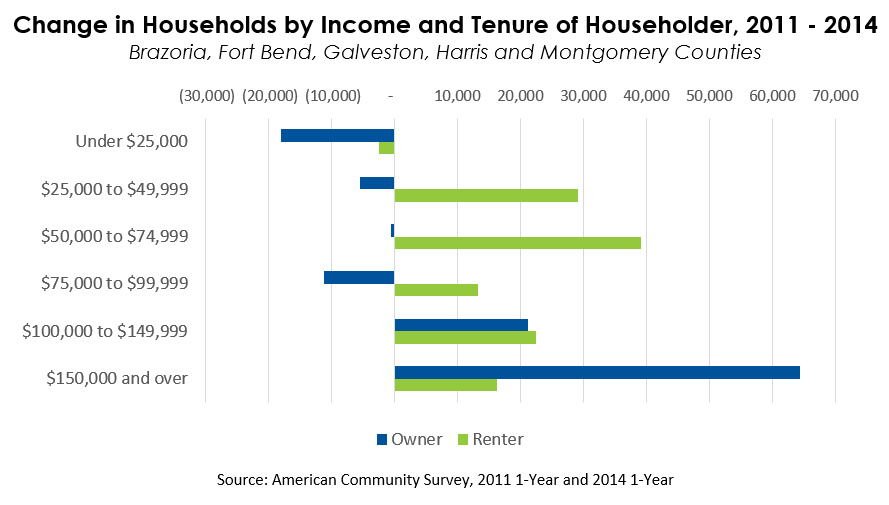
This next chart looks at changes in homeowner and renter households during this period. Clearly the most affluent households accounted for the sharpest increases in home ownership. However, renter household growth also tilted toward affluence.
The upstream oil and gas industry is known for well-paying jobs requiring a commensurate level of education. Given that it drove an above-average share of employment from 2011 to 2014, it’s no surprise that higher-paid households flooded the Houston housing market. The effect is amplified by the phenomenon of “assortive mating”, the documented tendency of highly—educated individuals to marry or life-partner with other similarly educated individuals, thus increasing the likelihood of creating a higher-income household.
What does this mean in terms of housing affordability and demand? Some quick, back-of-envelope-level calculations based on the assumption that households can reasonably afford up to 30% of their gross income for housing yields the following:
What does this mean in terms of housing affordability and demand? Some quick, back-of-envelope-level calculations based on the assumption that households can reasonably afford up to 30% of their gross income for housing yields the following:
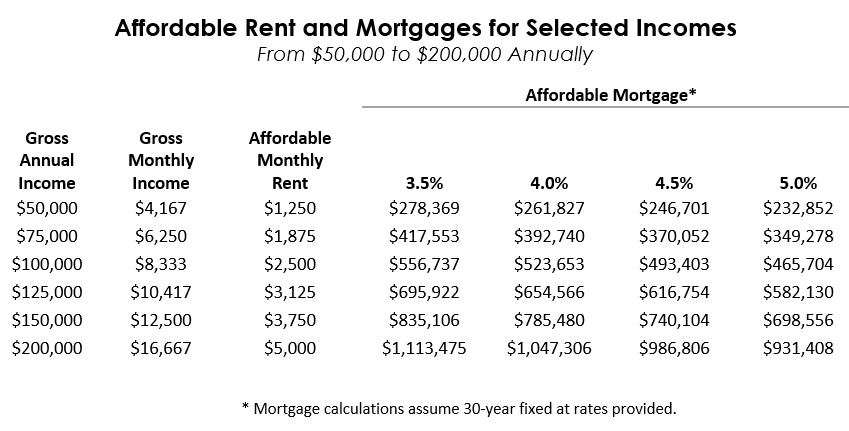
Of course, home buyers would also have to consider the non-mortgage components of PITI (principal, interest, taxes and insurance), so those estimates would probably decrease a little. And many households have other financial obligations that reduce their ability to pay, or simply don’t want to max out their spending on housing.
Nevertheless, the calculations show that in the income ranges which dominated the growth during the boom period, much of the demand for higher-priced homes came from households that could comfortably afford the increased cost.
What Now?
So what happens now that upstream oil and gas has gone into reverse? We don’t yet have new Census data to tell us what’s happened since 2014. However, QCEW data for the three upstream oil and gas industry sectors shown above indicate that employment lost nearly 11,000 jobs between 2nd Quarter 2014 and 3rd Quarter 2015 (the most recent QCEW figures available). Meanwhile, total employment gained nearly 60,000 jobs during that period, many of which are moderate to lower wage positions in “non-basic” industry sectors whose growth relies on serving the local population—think retail, hospitality, education, and health care.
The bottom line: While Houston’s growth is expected to continue, it will be at much slower pace. And, perhaps more importantly, this growth will not include a large number of high income households as was the case from 2011 to 2014.
About the Author: Steve Spillette is President of CDS Community Development Strategies and has performed a variety of market studies and financial pro-forma analyses for both private and public clients. Mr. Spillette has several years of experience in retail market analysis and multiple degrees related to real estate and planning--including an MBA from Texas A&M University.
 RSS Feed